| 0 | 1 | 2 | 3 | 4 | 5 | 6 | 7 | 8 | |
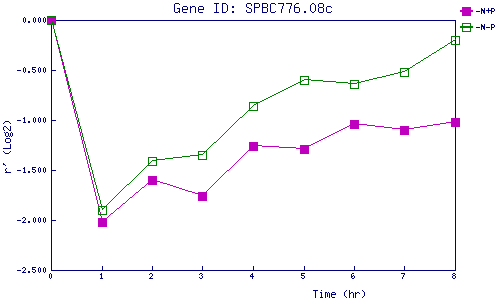
| -N+P | 0.000 | -2.020 | -1.595 | -1.760 | -1.259 | -1.293 | -1.038 | -1.101 | -1.023 |
| -N-P | 0.000 | -1.900 | -1.412 | -1.352 | -0.863 | -0.602 | -0.642 | -0.519 | -0.201 |
|
-N+P: Nitrogen starved in the presence of P-factor -N-P: Nitrogen starved in the absence of P-factor |
