hsk1
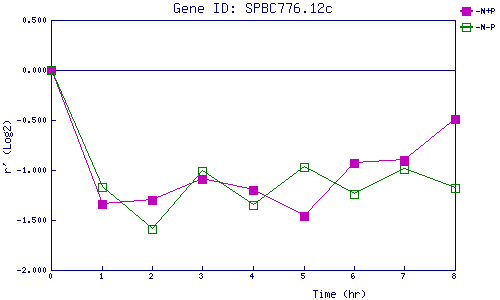
| 0 | 1 | 2 | 3 | 4 | 5 | 6 | 7 | 8 | |
| -N+P | 0.000 | -1.338 | -1.303 | -1.092 | -1.201 | -1.457 | -0.932 | -0.898 | -0.490 |
| -N-P | 0.000 | -1.172 | -1.594 | -1.011 | -1.346 | -0.972 | -1.238 | -0.989 | -1.177 |
|
-N+P: Nitrogen starved in the presence of P-factor -N-P: Nitrogen starved in the absence of P-factor |