cnd1
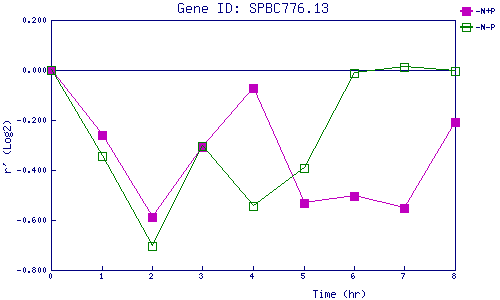
| 0 | 1 | 2 | 3 | 4 | 5 | 6 | 7 | 8 | |
| -N+P | 0.000 | -0.261 | -0.587 | -0.309 | -0.074 | -0.531 | -0.505 | -0.550 | -0.209 |
| -N-P | 0.000 | -0.344 | -0.702 | -0.305 | -0.543 | -0.392 | -0.013 | 0.012 | -0.003 |
|
-N+P: Nitrogen starved in the presence of P-factor -N-P: Nitrogen starved in the absence of P-factor |