plh1
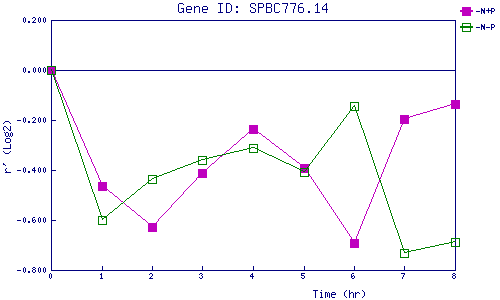
| 0 | 1 | 2 | 3 | 4 | 5 | 6 | 7 | 8 | |
| -N+P | 0.000 | -0.465 | -0.628 | -0.412 | -0.235 | -0.394 | -0.693 | -0.196 | -0.138 |
| -N-P | 0.000 | -0.599 | -0.436 | -0.362 | -0.313 | -0.408 | -0.146 | -0.733 | -0.690 |
|
-N+P: Nitrogen starved in the presence of P-factor -N-P: Nitrogen starved in the absence of P-factor |