| 0 | 1 | 2 | 3 | 4 | 5 | 6 | 7 | 8 | |
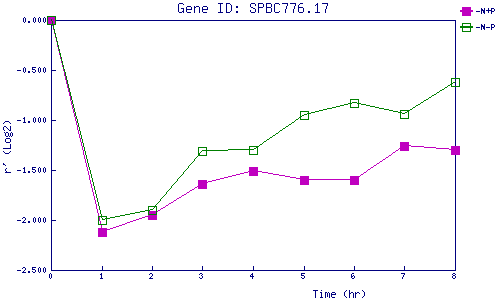
| -N+P | 0.000 | -2.120 | -1.947 | -1.643 | -1.509 | -1.601 | -1.604 | -1.262 | -1.299 |
| -N-P | 0.000 | -1.995 | -1.904 | -1.313 | -1.299 | -0.951 | -0.831 | -0.942 | -0.625 |
|
-N+P: Nitrogen starved in the presence of P-factor -N-P: Nitrogen starved in the absence of P-factor |