| 0 | 1 | 2 | 3 | 4 | 5 | 6 | 7 | 8 | |
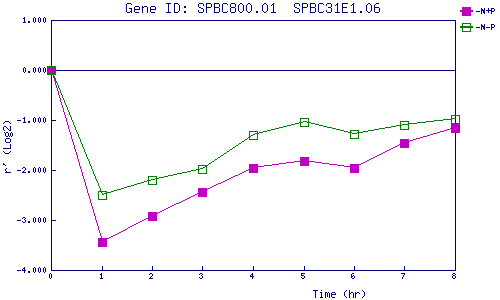
| -N+P | 0.000 | -3.440 | -2.924 | -2.435 | -1.961 | -1.816 | -1.952 | -1.465 | -1.154 |
| -N-P | 0.000 | -2.495 | -2.200 | -1.980 | -1.308 | -1.044 | -1.287 | -1.098 | -0.975 |
|
-N+P: Nitrogen starved in the presence of P-factor -N-P: Nitrogen starved in the absence of P-factor |