rpl37a-1 rpl43-1 rpl4301 rpl43
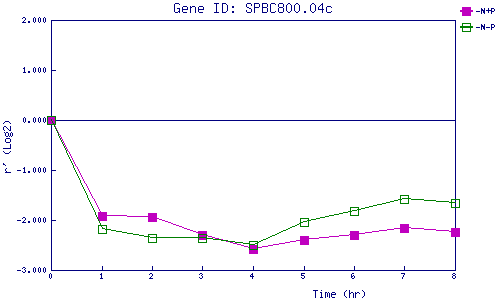
| 0 | 1 | 2 | 3 | 4 | 5 | 6 | 7 | 8 | |
| -N+P | 0.000 | -1.929 | -1.934 | -2.308 | -2.574 | -2.404 | -2.293 | -2.159 | -2.235 |
| -N-P | 0.000 | -2.180 | -2.366 | -2.350 | -2.506 | -2.042 | -1.825 | -1.573 | -1.658 |
|
-N+P: Nitrogen starved in the presence of P-factor -N-P: Nitrogen starved in the absence of P-factor |