tub1 atb2 alp2 ban5
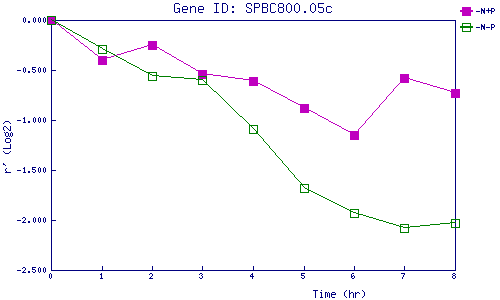
| 0 | 1 | 2 | 3 | 4 | 5 | 6 | 7 | 8 | |
| -N+P | 0.000 | -0.405 | -0.246 | -0.536 | -0.607 | -0.881 | -1.151 | -0.575 | -0.732 |
| -N-P | 0.000 | -0.290 | -0.560 | -0.595 | -1.092 | -1.677 | -1.933 | -2.085 | -2.034 |
|
-N+P: Nitrogen starved in the presence of P-factor -N-P: Nitrogen starved in the absence of P-factor |