| 0 | 1 | 2 | 3 | 4 | 5 | 6 | 7 | 8 | |
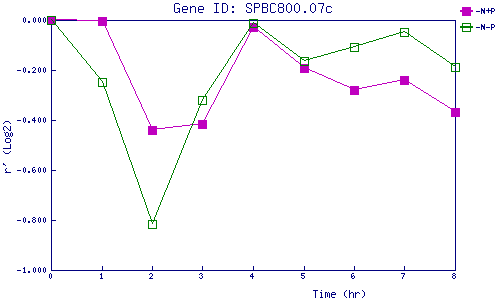
| -N+P | 0.000 | -0.005 | -0.439 | -0.417 | -0.027 | -0.190 | -0.282 | -0.239 | -0.367 |
| -N-P | 0.000 | -0.250 | -0.816 | -0.320 | -0.013 | -0.165 | -0.107 | -0.048 | -0.188 |
|
-N+P: Nitrogen starved in the presence of P-factor -N-P: Nitrogen starved in the absence of P-factor |