| 0 | 1 | 2 | 3 | 4 | 5 | 6 | 7 | 8 | |
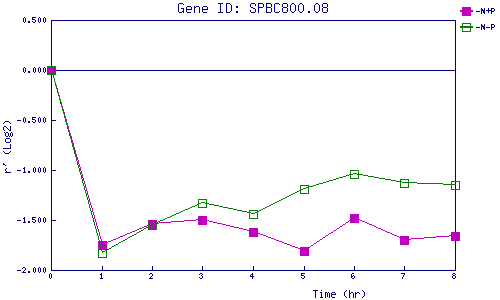
| -N+P | 0.000 | -1.750 | -1.539 | -1.503 | -1.616 | -1.806 | -1.484 | -1.696 | -1.665 |
| -N-P | 0.000 | -1.834 | -1.550 | -1.332 | -1.442 | -1.187 | -1.038 | -1.130 | -1.147 |
|
-N+P: Nitrogen starved in the presence of P-factor -N-P: Nitrogen starved in the absence of P-factor |