sum2
| 0 | 1 | 2 | 3 | 4 | 5 | 6 | 7 | 8 | |
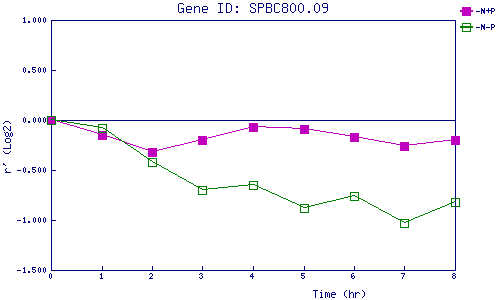
| -N+P | 0.000 | -0.150 | -0.318 | -0.203 | -0.073 | -0.094 | -0.173 | -0.261 | -0.196 |
| -N-P | 0.000 | -0.077 | -0.420 | -0.699 | -0.652 | -0.875 | -0.765 | -1.028 | -0.822 |
|
-N+P: Nitrogen starved in the presence of P-factor -N-P: Nitrogen starved in the absence of P-factor |
