rpl43-2 rpl37a-2 rpl4302 rpl43
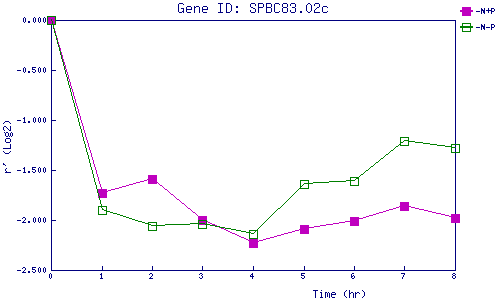
| 0 | 1 | 2 | 3 | 4 | 5 | 6 | 7 | 8 | |
| -N+P | 0.000 | -1.731 | -1.591 | -1.999 | -2.234 | -2.089 | -2.009 | -1.864 | -1.983 |
| -N-P | 0.000 | -1.905 | -2.058 | -2.039 | -2.135 | -1.643 | -1.611 | -1.210 | -1.283 |
|
-N+P: Nitrogen starved in the presence of P-factor -N-P: Nitrogen starved in the absence of P-factor |