apc15
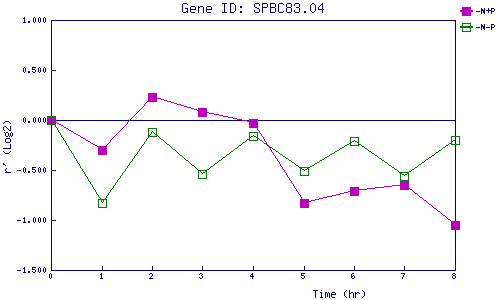
| 0 | 1 | 2 | 3 | 4 | 5 | 6 | 7 | 8 | |
| -N+P | 0.000 | -0.305 | 0.226 | 0.076 | -0.027 | -0.834 | -0.713 | -0.654 | -1.054 |
| -N-P | 0.000 | -0.833 | -0.116 | -0.544 | -0.162 | -0.514 | -0.210 | -0.555 | -0.200 |
|
-N+P: Nitrogen starved in the presence of P-factor -N-P: Nitrogen starved in the absence of P-factor |