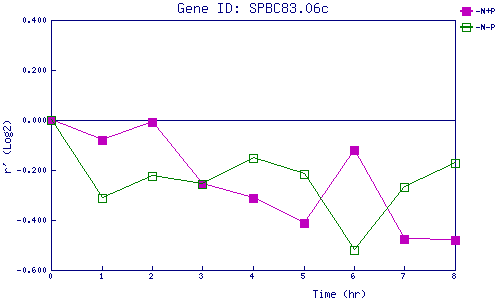
| 0 | 1 | 2 | 3 | 4 | 5 | 6 | 7 | 8 | |
| -N+P | 0.000 | -0.080 | -0.007 | -0.254 | -0.311 | -0.412 | -0.118 | -0.476 | -0.479 |
| -N-P | 0.000 | -0.311 | -0.224 | -0.254 | -0.151 | -0.215 | -0.521 | -0.269 | -0.173 |
|
-N+P: Nitrogen starved in the presence of P-factor -N-P: Nitrogen starved in the absence of P-factor |