ecm5
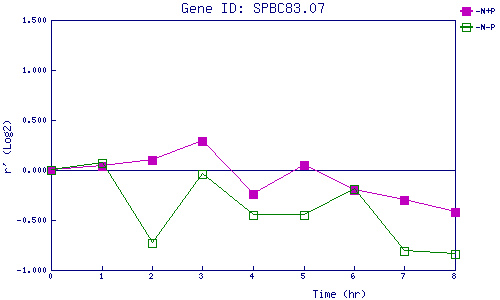
| 0 | 1 | 2 | 3 | 4 | 5 | 6 | 7 | 8 | |
| -N+P | 0.000 | 0.038 | 0.105 | 0.290 | -0.244 | 0.048 | -0.201 | -0.302 | -0.423 |
| -N-P | 0.000 | 0.073 | -0.727 | -0.037 | -0.448 | -0.450 | -0.187 | -0.806 | -0.842 |
|
-N+P: Nitrogen starved in the presence of P-factor -N-P: Nitrogen starved in the absence of P-factor |