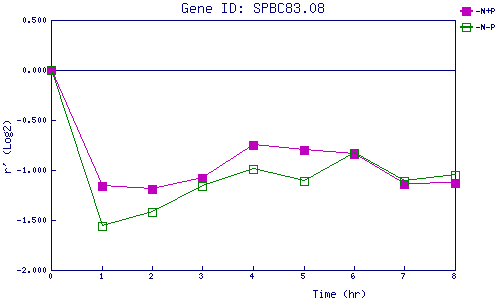
| 0 | 1 | 2 | 3 | 4 | 5 | 6 | 7 | 8 | |
| -N+P | 0.000 | -1.157 | -1.187 | -1.080 | -0.752 | -0.799 | -0.838 | -1.138 | -1.126 |
| -N-P | 0.000 | -1.564 | -1.420 | -1.159 | -0.994 | -1.113 | -0.829 | -1.107 | -1.054 |
|
-N+P: Nitrogen starved in the presence of P-factor -N-P: Nitrogen starved in the absence of P-factor |