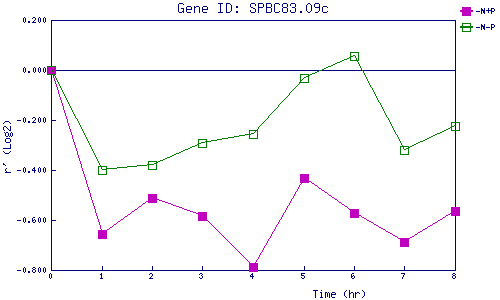
| 0 | 1 | 2 | 3 | 4 | 5 | 6 | 7 | 8 | |
| -N+P | 0.000 | -0.654 | -0.510 | -0.582 | -0.789 | -0.431 | -0.573 | -0.687 | -0.563 |
| -N-P | 0.000 | -0.399 | -0.379 | -0.291 | -0.258 | -0.032 | 0.058 | -0.318 | -0.223 |
|
-N+P: Nitrogen starved in the presence of P-factor -N-P: Nitrogen starved in the absence of P-factor |