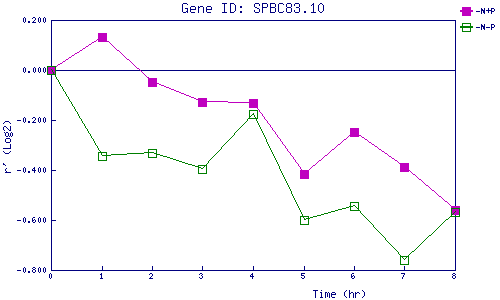
| 0 | 1 | 2 | 3 | 4 | 5 | 6 | 7 | 8 | |
| -N+P | 0.000 | 0.131 | -0.048 | -0.128 | -0.132 | -0.418 | -0.249 | -0.388 | -0.560 |
| -N-P | 0.000 | -0.342 | -0.331 | -0.397 | -0.174 | -0.602 | -0.544 | -0.762 | -0.569 |
|
-N+P: Nitrogen starved in the presence of P-factor -N-P: Nitrogen starved in the absence of P-factor |