rfc5
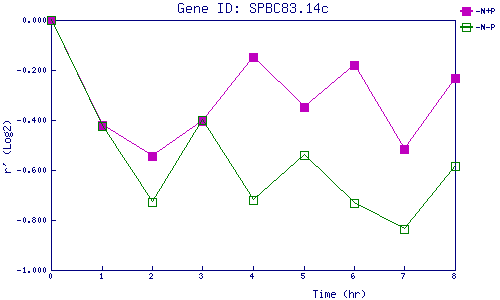
| 0 | 1 | 2 | 3 | 4 | 5 | 6 | 7 | 8 | |
| -N+P | 0.000 | -0.420 | -0.543 | -0.404 | -0.147 | -0.349 | -0.181 | -0.515 | -0.230 |
| -N-P | 0.000 | -0.422 | -0.728 | -0.402 | -0.722 | -0.539 | -0.733 | -0.836 | -0.585 |
|
-N+P: Nitrogen starved in the presence of P-factor -N-P: Nitrogen starved in the absence of P-factor |