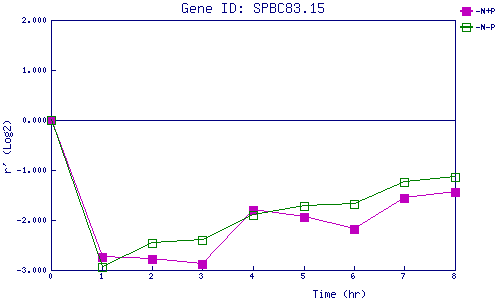
| 0 | 1 | 2 | 3 | 4 | 5 | 6 | 7 | 8 | |
| -N+P | 0.000 | -2.746 | -2.780 | -2.876 | -1.798 | -1.948 | -2.172 | -1.567 | -1.432 |
| -N-P | 0.000 | -2.949 | -2.464 | -2.396 | -1.908 | -1.717 | -1.673 | -1.242 | -1.138 |
|
-N+P: Nitrogen starved in the presence of P-factor -N-P: Nitrogen starved in the absence of P-factor |