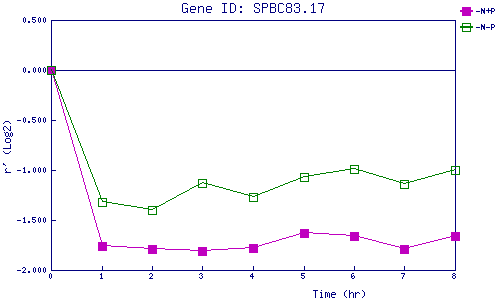
| 0 | 1 | 2 | 3 | 4 | 5 | 6 | 7 | 8 | |
| -N+P | 0.000 | -1.759 | -1.792 | -1.814 | -1.780 | -1.627 | -1.657 | -1.792 | -1.665 |
| -N-P | 0.000 | -1.325 | -1.398 | -1.133 | -1.271 | -1.066 | -0.986 | -1.139 | -1.005 |
|
-N+P: Nitrogen starved in the presence of P-factor -N-P: Nitrogen starved in the absence of P-factor |