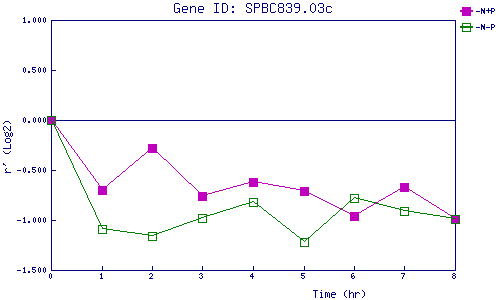
| 0 | 1 | 2 | 3 | 4 | 5 | 6 | 7 | 8 | |
| -N+P | 0.000 | -0.699 | -0.280 | -0.759 | -0.616 | -0.709 | -0.955 | -0.669 | -0.989 |
| -N-P | 0.000 | -1.087 | -1.162 | -0.977 | -0.821 | -1.221 | -0.783 | -0.910 | -0.989 |
|
-N+P: Nitrogen starved in the presence of P-factor -N-P: Nitrogen starved in the absence of P-factor |