rpl8-3 rpk5-b rpl803 rpkD4 SPBTRNALYS.06
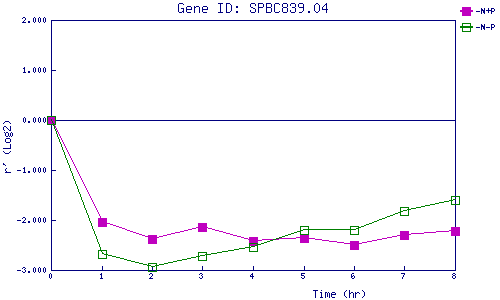
| 0 | 1 | 2 | 3 | 4 | 5 | 6 | 7 | 8 | |
| -N+P | 0.000 | -2.036 | -2.374 | -2.135 | -2.427 | -2.363 | -2.493 | -2.291 | -2.223 |
| -N-P | 0.000 | -2.683 | -2.933 | -2.720 | -2.548 | -2.196 | -2.201 | -1.820 | -1.601 |
|
-N+P: Nitrogen starved in the presence of P-factor -N-P: Nitrogen starved in the absence of P-factor |