ibp1
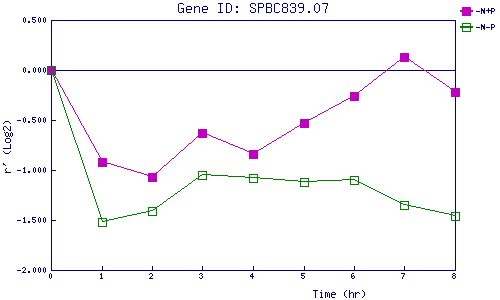
| 0 | 1 | 2 | 3 | 4 | 5 | 6 | 7 | 8 | |
| -N+P | 0.000 | -0.923 | -1.067 | -0.630 | -0.835 | -0.529 | -0.259 | 0.128 | -0.216 |
| -N-P | 0.000 | -1.519 | -1.410 | -1.049 | -1.083 | -1.121 | -1.105 | -1.347 | -1.458 |
|
-N+P: Nitrogen starved in the presence of P-factor -N-P: Nitrogen starved in the absence of P-factor |