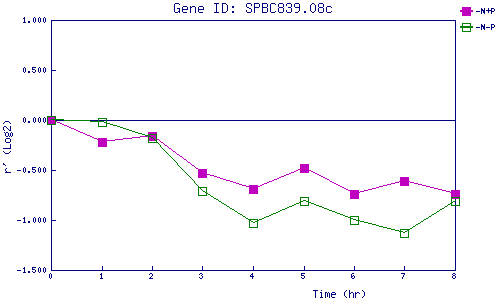
| 0 | 1 | 2 | 3 | 4 | 5 | 6 | 7 | 8 | |
| -N+P | 0.000 | -0.218 | -0.165 | -0.526 | -0.689 | -0.482 | -0.741 | -0.612 | -0.743 |
| -N-P | 0.000 | -0.025 | -0.180 | -0.712 | -1.032 | -0.806 | -1.004 | -1.134 | -0.809 |
|
-N+P: Nitrogen starved in the presence of P-factor -N-P: Nitrogen starved in the absence of P-factor |