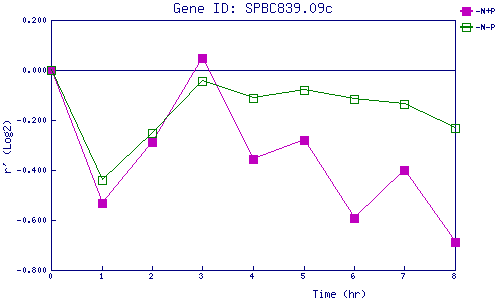
| 0 | 1 | 2 | 3 | 4 | 5 | 6 | 7 | 8 | |
| -N+P | 0.000 | -0.531 | -0.287 | 0.046 | -0.357 | -0.282 | -0.590 | -0.400 | -0.687 |
| -N-P | 0.000 | -0.442 | -0.251 | -0.045 | -0.113 | -0.081 | -0.115 | -0.138 | -0.230 |
|
-N+P: Nitrogen starved in the presence of P-factor -N-P: Nitrogen starved in the absence of P-factor |