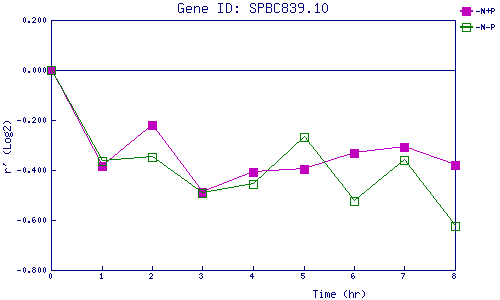
| 0 | 1 | 2 | 3 | 4 | 5 | 6 | 7 | 8 | |
| -N+P | 0.000 | -0.382 | -0.220 | -0.488 | -0.406 | -0.397 | -0.333 | -0.307 | -0.379 |
| -N-P | 0.000 | -0.365 | -0.349 | -0.492 | -0.458 | -0.268 | -0.523 | -0.360 | -0.622 |
|
-N+P: Nitrogen starved in the presence of P-factor -N-P: Nitrogen starved in the absence of P-factor |