hut1
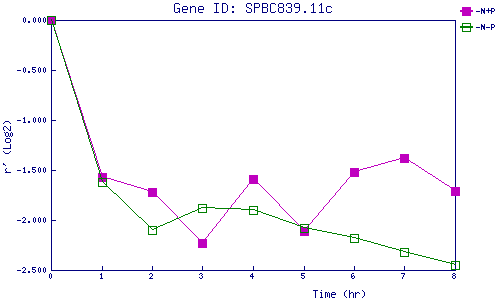
| 0 | 1 | 2 | 3 | 4 | 5 | 6 | 7 | 8 | |
| -N+P | 0.000 | -1.571 | -1.716 | -2.230 | -1.593 | -2.112 | -1.520 | -1.376 | -1.711 |
| -N-P | 0.000 | -1.624 | -2.095 | -1.879 | -1.904 | -2.084 | -2.178 | -2.317 | -2.451 |
|
-N+P: Nitrogen starved in the presence of P-factor -N-P: Nitrogen starved in the absence of P-factor |