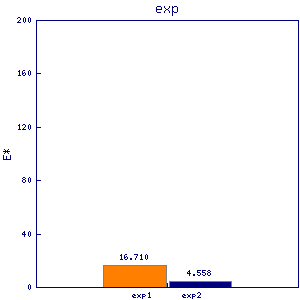
rpc31
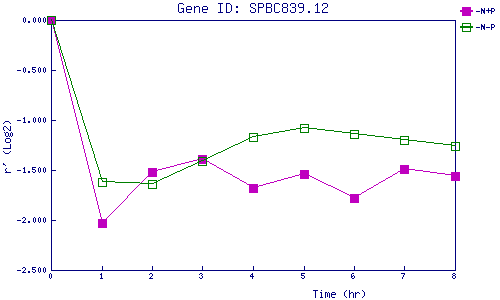
| 0 | 1 | 2 | 3 | 4 | 5 | 6 | 7 | 8 | |
| -N+P | 0.000 | -2.032 | -1.518 | -1.394 | -1.677 | -1.539 | -1.775 | -1.487 | -1.566 |
| -N-P | 0.000 | -1.616 | -1.644 | -1.408 | -1.168 | -1.082 | -1.140 | -1.197 | -1.259 |
|
-N+P: Nitrogen starved in the presence of P-factor -N-P: Nitrogen starved in the absence of P-factor |