rpl16-1 rpl13a-1 rpl1601
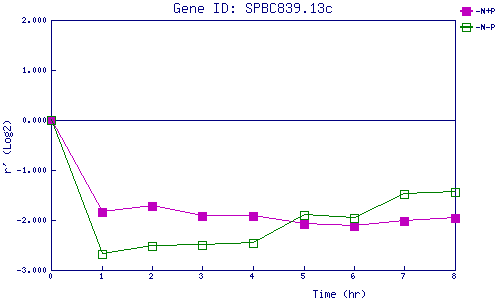
| 0 | 1 | 2 | 3 | 4 | 5 | 6 | 7 | 8 | |
| -N+P | 0.000 | -1.843 | -1.731 | -1.916 | -1.917 | -2.082 | -2.115 | -2.012 | -1.953 |
| -N-P | 0.000 | -2.686 | -2.525 | -2.496 | -2.467 | -1.896 | -1.970 | -1.480 | -1.444 |
|
-N+P: Nitrogen starved in the presence of P-factor -N-P: Nitrogen starved in the absence of P-factor |