ef1-b ef1a-c
| 0 | 1 | 2 | 3 | 4 | 5 | 6 | 7 | 8 | |
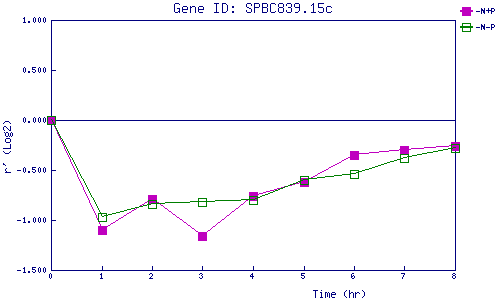
| -N+P | 0.000 | -1.105 | -0.793 | -1.155 | -0.757 | -0.618 | -0.349 | -0.303 | -0.261 |
| -N-P | 0.000 | -0.974 | -0.842 | -0.818 | -0.796 | -0.602 | -0.544 | -0.384 | -0.276 |
|
-N+P: Nitrogen starved in the presence of P-factor -N-P: Nitrogen starved in the absence of P-factor |