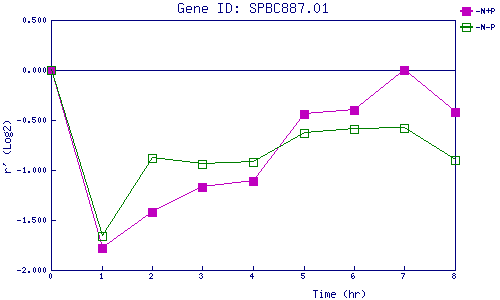
| 0 | 1 | 2 | 3 | 4 | 5 | 6 | 7 | 8 | |
| -N+P | 0.000 | -1.778 | -1.422 | -1.166 | -1.111 | -0.444 | -0.399 | 0.000 | -0.417 |
| -N-P | 0.000 | -1.665 | -0.882 | -0.939 | -0.915 | -0.634 | -0.591 | -0.579 | -0.903 |
|
-N+P: Nitrogen starved in the presence of P-factor -N-P: Nitrogen starved in the absence of P-factor |