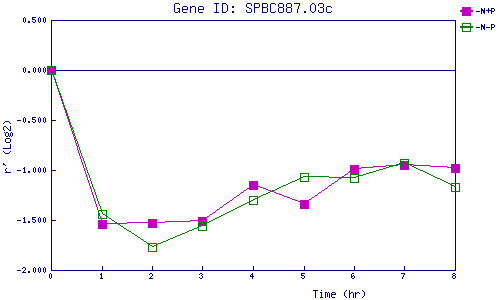
| 0 | 1 | 2 | 3 | 4 | 5 | 6 | 7 | 8 | |
| -N+P | 0.000 | -1.537 | -1.533 | -1.510 | -1.146 | -1.340 | -0.987 | -0.953 | -0.979 |
| -N-P | 0.000 | -1.444 | -1.772 | -1.565 | -1.305 | -1.074 | -1.077 | -0.926 | -1.173 |
|
-N+P: Nitrogen starved in the presence of P-factor -N-P: Nitrogen starved in the absence of P-factor |