grd19
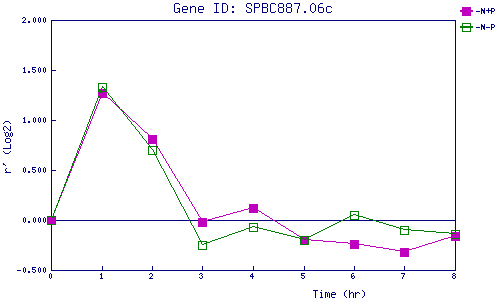
| 0 | 1 | 2 | 3 | 4 | 5 | 6 | 7 | 8 | |
| -N+P | 0.000 | 1.271 | 0.811 | -0.024 | 0.123 | -0.200 | -0.241 | -0.323 | -0.156 |
| -N-P | 0.000 | 1.332 | 0.697 | -0.254 | -0.073 | -0.203 | 0.046 | -0.096 | -0.143 |
|
-N+P: Nitrogen starved in the presence of P-factor -N-P: Nitrogen starved in the absence of P-factor |