| 0 | 1 | 2 | 3 | 4 | 5 | 6 | 7 | 8 | |
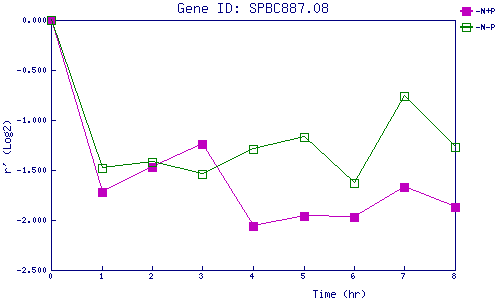
| -N+P | 0.000 | -1.720 | -1.469 | -1.241 | -2.057 | -1.965 | -1.970 | -1.670 | -1.870 |
| -N-P | 0.000 | -1.481 | -1.424 | -1.544 | -1.286 | -1.170 | -1.633 | -0.760 | -1.269 |
|
-N+P: Nitrogen starved in the presence of P-factor -N-P: Nitrogen starved in the absence of P-factor |