| 0 | 1 | 2 | 3 | 4 | 5 | 6 | 7 | 8 | |
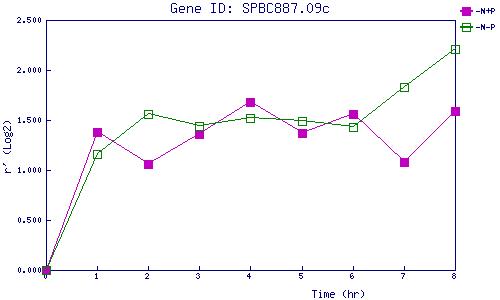
| -N+P | 0.000 | 1.375 | 1.058 | 1.356 | 1.677 | 1.369 | 1.566 | 1.076 | 1.592 |
| -N-P | 0.000 | 1.165 | 1.561 | 1.436 | 1.516 | 1.494 | 1.431 | 1.829 | 2.210 |
|
-N+P: Nitrogen starved in the presence of P-factor -N-P: Nitrogen starved in the absence of P-factor |
| Gene | ||||||||||||||||||||||||||||||
| Gene expression upon nitrogen starvation | ||||||||||||||||||||||||||||||
|
||||||||||||||||||||||||||||||
|
|
||||||||||||||||||||||||||||||
| Values plotted in the graph | ||||||||||||||||||||||||||||||
|
|
||||||||||||||||||||||||||||||
|
||||||||||||||||||||||||||||||
| Number of mRNA in a vegetative growing cell (estimated roughly) | ||||||||||||||||||||||||||||||
|
|
||||||||||||||||||||||||||||||
|
|
||||||||||||||||||||||||||||||