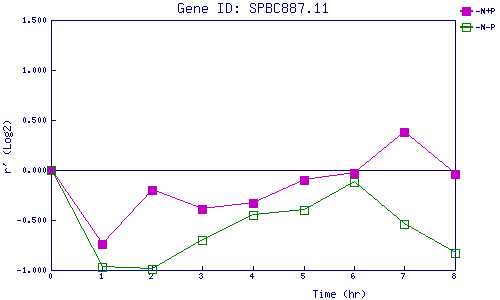
| 0 | 1 | 2 | 3 | 4 | 5 | 6 | 7 | 8 | |
| -N+P | 0.000 | -0.740 | -0.195 | -0.388 | -0.326 | -0.101 | -0.028 | 0.375 | -0.043 |
| -N-P | 0.000 | -0.968 | -0.992 | -0.696 | -0.450 | -0.405 | -0.117 | -0.541 | -0.831 |
|
-N+P: Nitrogen starved in the presence of P-factor -N-P: Nitrogen starved in the absence of P-factor |