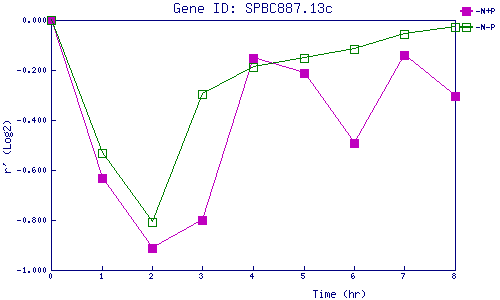
| 0 | 1 | 2 | 3 | 4 | 5 | 6 | 7 | 8 | |
| -N+P | 0.000 | -0.631 | -0.912 | -0.802 | -0.154 | -0.211 | -0.491 | -0.140 | -0.305 |
| -N-P | 0.000 | -0.532 | -0.808 | -0.295 | -0.189 | -0.150 | -0.116 | -0.057 | -0.027 |
|
-N+P: Nitrogen starved in the presence of P-factor -N-P: Nitrogen starved in the absence of P-factor |