pif1 pfh1
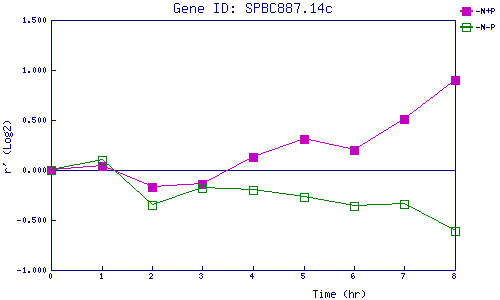
| 0 | 1 | 2 | 3 | 4 | 5 | 6 | 7 | 8 | |
| -N+P | 0.000 | 0.041 | -0.168 | -0.135 | 0.131 | 0.306 | 0.205 | 0.511 | 0.900 |
| -N-P | 0.000 | 0.102 | -0.352 | -0.179 | -0.195 | -0.269 | -0.356 | -0.344 | -0.614 |
|
-N+P: Nitrogen starved in the presence of P-factor -N-P: Nitrogen starved in the absence of P-factor |