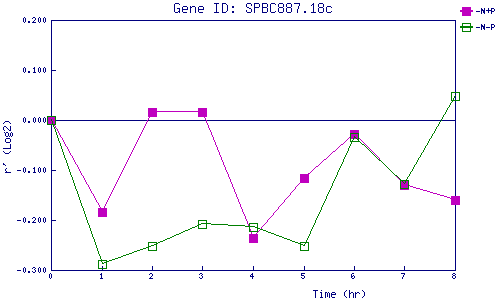
| 0 | 1 | 2 | 3 | 4 | 5 | 6 | 7 | 8 | |
| -N+P | 0.000 | -0.185 | 0.017 | 0.016 | -0.237 | -0.115 | -0.027 | -0.130 | -0.160 |
| -N-P | 0.000 | -0.288 | -0.252 | -0.209 | -0.214 | -0.251 | -0.034 | -0.127 | 0.049 |
|
-N+P: Nitrogen starved in the presence of P-factor -N-P: Nitrogen starved in the absence of P-factor |