| 0 | 1 | 2 | 3 | 4 | 5 | 6 | 7 | 8 | |
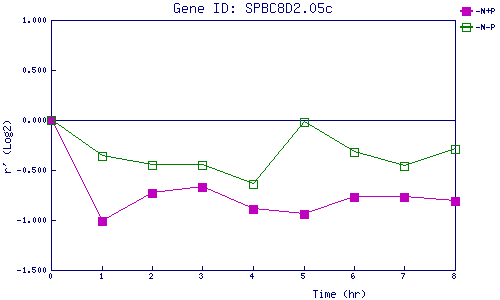
| -N+P | 0.000 | -1.014 | -0.731 | -0.668 | -0.890 | -0.938 | -0.773 | -0.766 | -0.809 |
| -N-P | 0.000 | -0.360 | -0.450 | -0.453 | -0.641 | -0.022 | -0.320 | -0.461 | -0.290 |
|
-N+P: Nitrogen starved in the presence of P-factor -N-P: Nitrogen starved in the absence of P-factor |