| 0 | 1 | 2 | 3 | 4 | 5 | 6 | 7 | 8 | |
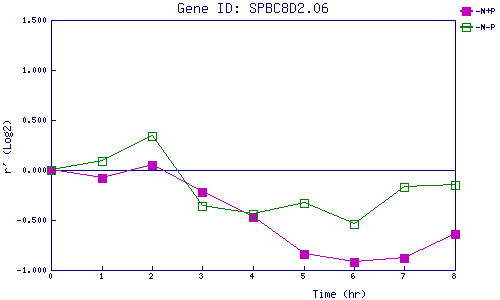
| -N+P | 0.000 | -0.085 | 0.053 | -0.225 | -0.472 | -0.842 | -0.925 | -0.876 | -0.642 |
| -N-P | 0.000 | 0.093 | 0.335 | -0.357 | -0.436 | -0.329 | -0.540 | -0.169 | -0.150 |
|
-N+P: Nitrogen starved in the presence of P-factor -N-P: Nitrogen starved in the absence of P-factor |