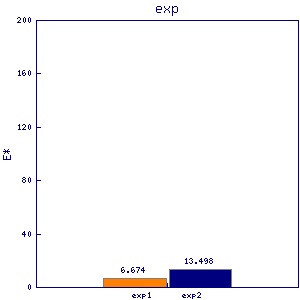
sfc9
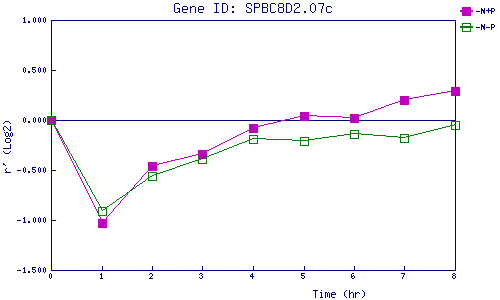
| 0 | 1 | 2 | 3 | 4 | 5 | 6 | 7 | 8 | |
| -N+P | 0.000 | -1.034 | -0.457 | -0.342 | -0.080 | 0.038 | 0.021 | 0.198 | 0.294 |
| -N-P | 0.000 | -0.914 | -0.563 | -0.391 | -0.190 | -0.206 | -0.136 | -0.175 | -0.048 |
|
-N+P: Nitrogen starved in the presence of P-factor -N-P: Nitrogen starved in the absence of P-factor |