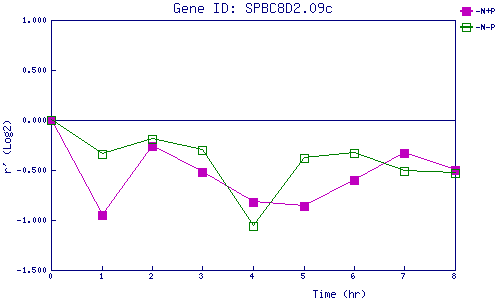
| 0 | 1 | 2 | 3 | 4 | 5 | 6 | 7 | 8 | |
| -N+P | 0.000 | -0.950 | -0.265 | -0.524 | -0.822 | -0.862 | -0.599 | -0.326 | -0.495 |
| -N-P | 0.000 | -0.343 | -0.194 | -0.299 | -1.060 | -0.379 | -0.334 | -0.508 | -0.530 |
|
-N+P: Nitrogen starved in the presence of P-factor -N-P: Nitrogen starved in the absence of P-factor |