| 0 | 1 | 2 | 3 | 4 | 5 | 6 | 7 | 8 | |
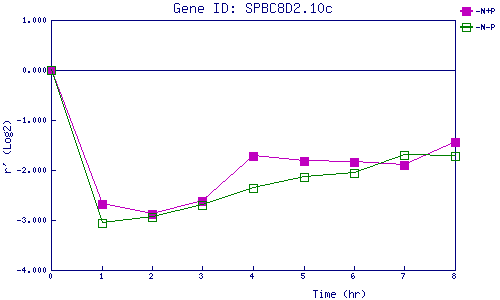
| -N+P | 0.000 | -2.674 | -2.876 | -2.625 | -1.723 | -1.829 | -1.841 | -1.897 | -1.447 |
| -N-P | 0.000 | -3.060 | -2.934 | -2.696 | -2.369 | -2.144 | -2.068 | -1.692 | -1.722 |
|
-N+P: Nitrogen starved in the presence of P-factor -N-P: Nitrogen starved in the absence of P-factor |