pI053
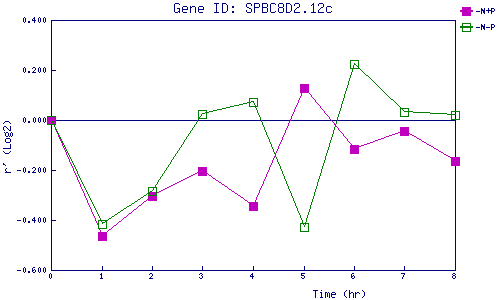
| 0 | 1 | 2 | 3 | 4 | 5 | 6 | 7 | 8 | |
| -N+P | 0.000 | -0.465 | -0.305 | -0.204 | -0.346 | 0.129 | -0.115 | -0.043 | -0.163 |
| -N-P | 0.000 | -0.416 | -0.283 | 0.023 | 0.072 | -0.428 | 0.224 | 0.033 | 0.020 |
|
-N+P: Nitrogen starved in the presence of P-factor -N-P: Nitrogen starved in the absence of P-factor |