pI052
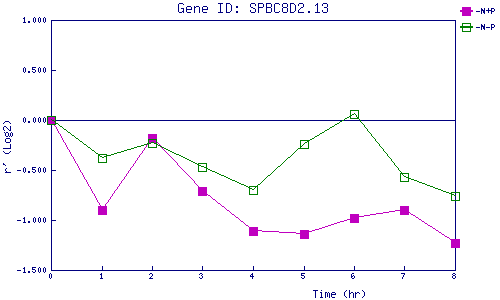
| 0 | 1 | 2 | 3 | 4 | 5 | 6 | 7 | 8 | |
| -N+P | 0.000 | -0.903 | -0.185 | -0.712 | -1.108 | -1.144 | -0.980 | -0.903 | -1.229 |
| -N-P | 0.000 | -0.380 | -0.230 | -0.471 | -0.697 | -0.237 | 0.065 | -0.569 | -0.759 |
|
-N+P: Nitrogen starved in the presence of P-factor -N-P: Nitrogen starved in the absence of P-factor |