sed5
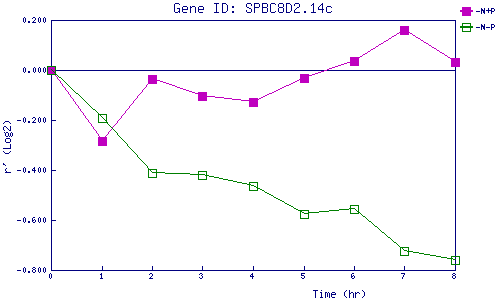
| 0 | 1 | 2 | 3 | 4 | 5 | 6 | 7 | 8 | |
| -N+P | 0.000 | -0.285 | -0.037 | -0.105 | -0.126 | -0.030 | 0.035 | 0.158 | 0.033 |
| -N-P | 0.000 | -0.192 | -0.412 | -0.419 | -0.462 | -0.578 | -0.556 | -0.725 | -0.761 |
|
-N+P: Nitrogen starved in the presence of P-factor -N-P: Nitrogen starved in the absence of P-factor |