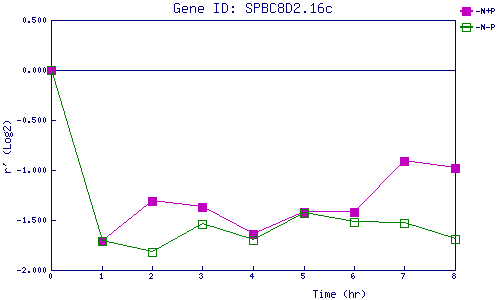
| 0 | 1 | 2 | 3 | 4 | 5 | 6 | 7 | 8 | |
| -N+P | 0.000 | -1.715 | -1.314 | -1.369 | -1.640 | -1.425 | -1.421 | -0.911 | -0.982 |
| -N-P | 0.000 | -1.710 | -1.823 | -1.540 | -1.698 | -1.427 | -1.520 | -1.533 | -1.690 |
|
-N+P: Nitrogen starved in the presence of P-factor -N-P: Nitrogen starved in the absence of P-factor |