mde3
| 0 | 1 | 2 | 3 | 4 | 5 | 6 | 7 | 8 | |
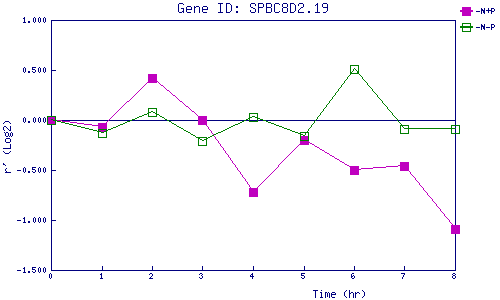
| -N+P | 0.000 | -0.066 | 0.417 | 0.002 | -0.720 | -0.199 | -0.498 | -0.457 | -1.089 |
| -N-P | 0.000 | -0.127 | 0.081 | -0.209 | 0.031 | -0.162 | 0.513 | -0.091 | -0.092 |
|
-N+P: Nitrogen starved in the presence of P-factor -N-P: Nitrogen starved in the absence of P-factor |